 ar
ar bg
bg hr
hr cs
cs da
da nl
nl fi
fi fr
fr de
de el
el hi
hi it
it ko
ko no
no pl
pl pt
pt ro
ro ru
ru es
es sv
sv tl
tl iw
iw id
id lv
lv lt
lt sr
sr sk
sk sl
sl uk
uk vi
vi et
et hu
hu th
th tr
tr fa
fa ms
ms hy
hy ka
ka ur
ur bn
bn mn
mn ta
ta kk
kk uz
uz ku
ku
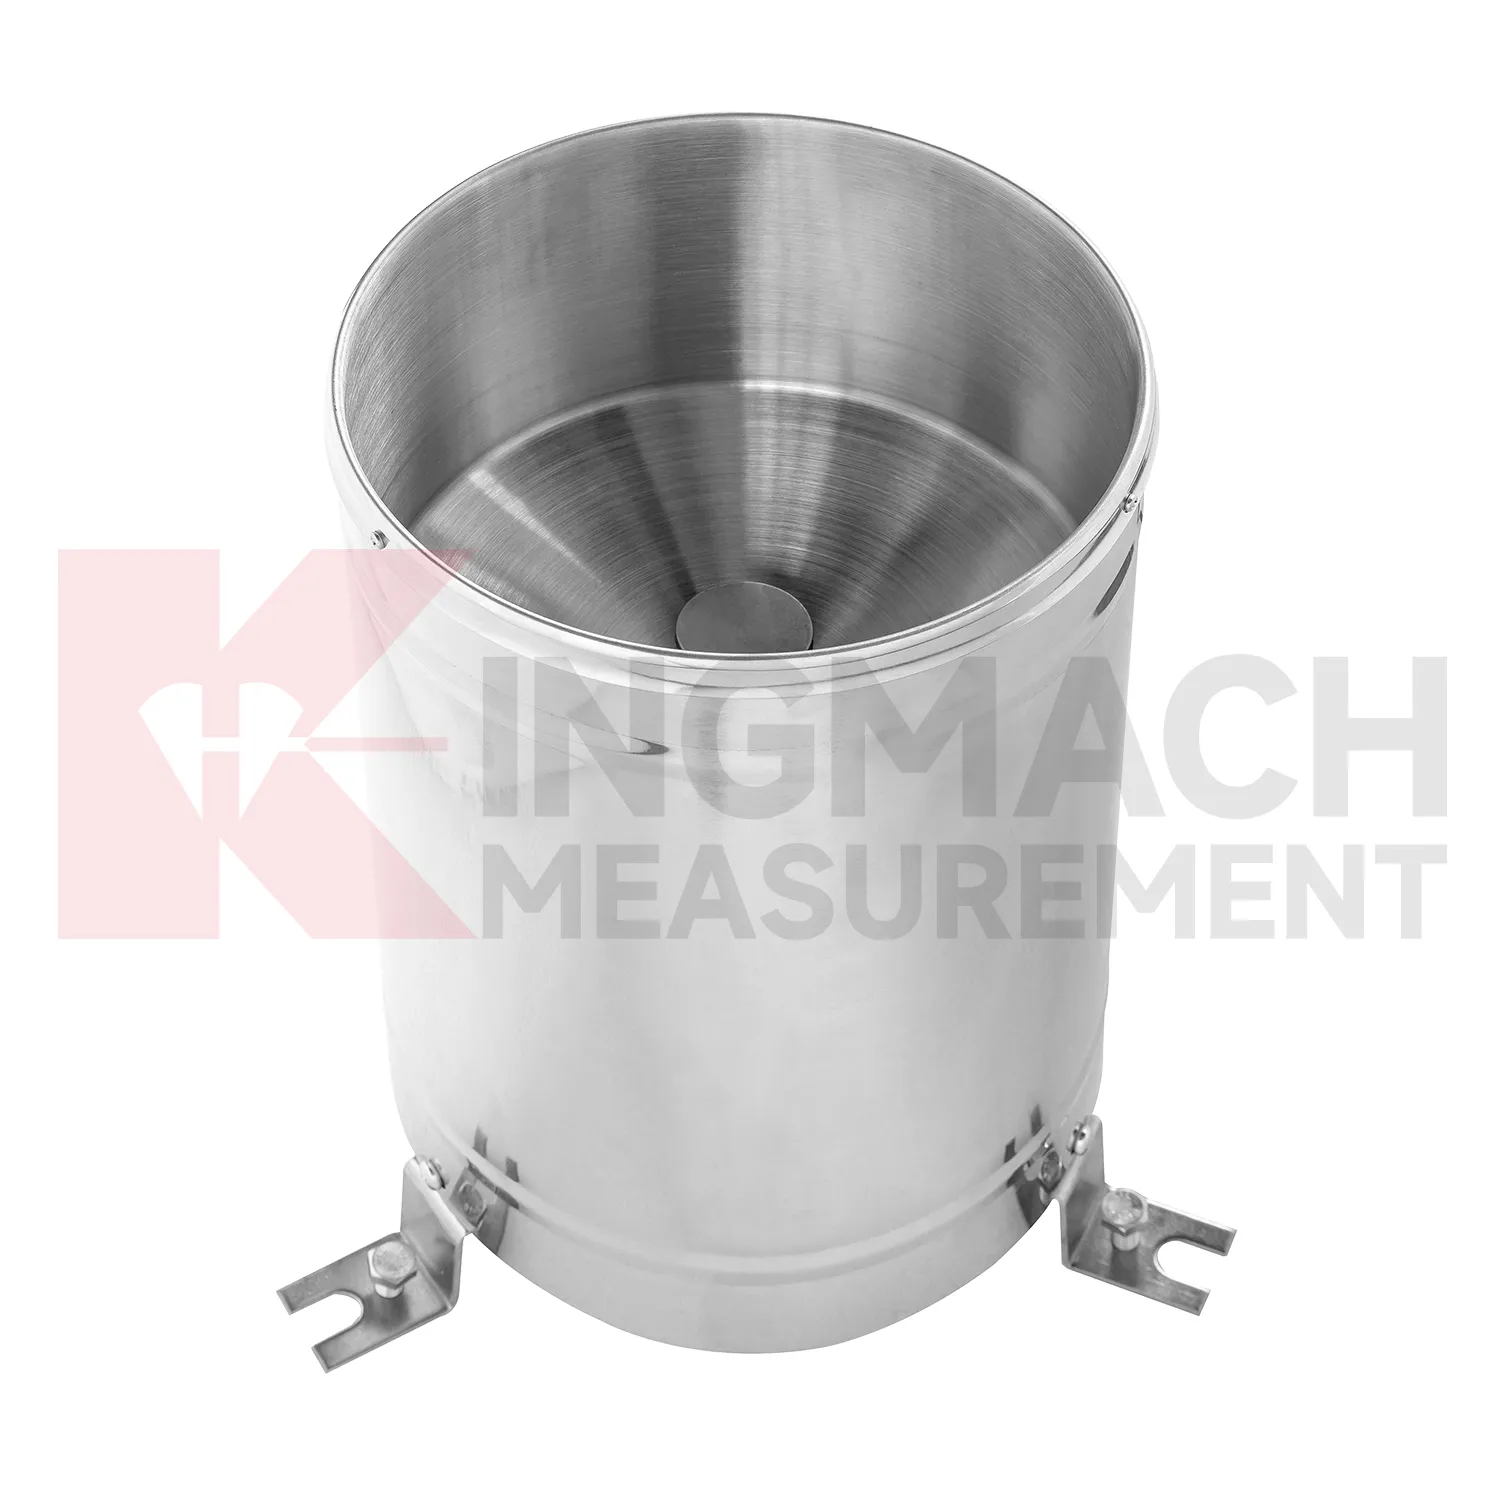
rain gauge tipping bucket
Data acquisition for Kingmach rain gauge tipping bucket should be organized around units, time, and relationships. Environmental channels may report rainfall, wind, pressure, temperature, humidity, or soil wetness, and each needs a clear unit and location. A mixed station becomes confusing if channel names are vague or if the data logger does not preserve the relation between environmental points and structural points. The project file should define which environmental channel supports which engineering review. Rainfall may connect to slope movement. Wind may connect to vibration. Temperature may connect to strain. Humidity may connect to cabinet maintenance. A simple channel map can save a great deal of time during an alarm. Good acquisition practice makes environmental data reliable enough to use when the site is under stress.
Long-term value comes from consistency. A channel that keeps the same location, unit, maintenance history, and linked asset record can support seasonal comparison, post-storm review, and handover between construction and operation teams.
Maintenance teams should record cleaning, access difficulty, enclosure condition, cable repair, vegetation growth, nearby equipment changes, and the first normal reading after work. Those notes protect the meaning of the curve when old data is reviewed months later.
The environmental point should be part of a named monitoring question. It may explain wetting, drying, wind exposure, thermal movement, cabinet stress, or pressure variation, but that purpose needs to be visible in drawings and reports.
Application of rain gauge tipping bucket
Urban environmental stations use Kingmach rain gauge tipping bucket to support infrastructure management across bridges, tunnels, public buildings, drainage areas, transport corridors, and exposed equipment sites. A station may record rain, wind, air temperature, humidity, pressure, or soil wetness depending on the risk being managed. The most important design rule is representativeness. A rain point blocked by a roof edge, a wind point sheltered by a wall, or a humidity point hidden in an unrelated cabinet can mislead users. Public infrastructure data may be reviewed by many teams, so units, point names, installation photos, and maintenance notes must be clear. A well-run station helps connect environmental change to inspections, drainage response, traffic planning, and structural monitoring.
Long-term value comes from consistency. A channel that keeps the same location, unit, maintenance history, and linked asset record can support seasonal comparison, post-storm review, and handover between construction and operation teams.
Maintenance teams should record cleaning, access difficulty, enclosure condition, cable repair, vegetation growth, nearby equipment changes, and the first normal reading after work. Those notes protect the meaning of the curve when old data is reviewed months later.
The environmental point should be part of a named monitoring question. It may explain wetting, drying, wind exposure, thermal movement, cabinet stress, or pressure variation, but that purpose needs to be visible in drawings and reports.
The future of rain gauge tipping bucket
Remote station health will become more important for Kingmach rain gauge tipping bucket. Environmental points are often placed on slopes, bridges, dams, towers, construction sites, and irrigation areas where access is inconvenient. A future-ready station should report whether it is powered, communicating, collecting plausible values, and recently maintained. Missing data during a storm can be more serious than missing data during calm weather. Maintenance teams need to know whether a silence means quiet conditions, power trouble, blocked equipment, or communication loss. Better station-health reporting will help owners trust environmental data during the events that matter most.
Maintenance teams should record cleaning, access difficulty, enclosure condition, cable repair, vegetation growth, nearby equipment changes, and the first normal reading after work. Those notes protect the meaning of the curve when old data is reviewed months later.
The environmental point should be part of a named monitoring question. It may explain wetting, drying, wind exposure, thermal movement, cabinet stress, or pressure variation, but that purpose needs to be visible in drawings and reports.
Care & Maintenance of rain gauge tipping bucket
Communication and unit checks are essential for Kingmach rain gauge tipping bucket. Environmental stations may contain rainfall, wind, pressure, humidity, temperature, and soil-condition channels with different units and signal paths. After cabinet work, software changes, or data logger replacement, confirm that each channel still points to the correct location and unit. A swapped channel can turn a useful record into a confusing report. Wiring diagrams, channel tables, scale factors, and point photos should be kept together. During an alarm, the reviewer should not have to guess whether a curve is wind speed, pressure, rainfall, or humidity. Clear communication records make environmental data usable under pressure.
Maintenance teams should record cleaning, access difficulty, enclosure condition, cable repair, vegetation growth, nearby equipment changes, and the first normal reading after work. Those notes protect the meaning of the curve when old data is reviewed months later.
The environmental point should be part of a named monitoring question. It may explain wetting, drying, wind exposure, thermal movement, cabinet stress, or pressure variation, but that purpose needs to be visible in drawings and reports.
Kingmach rain gauge tipping bucket
Rainfall records are a central part of Kingmach rain gauge tipping bucket for slopes, embankments, dams, tunnel portals, and construction sites. Rain does not always cause immediate movement; water may enter the ground, raise pore pressure, soften material, or change runoff over time. That delay is exactly why a dated rainfall record matters. Engineers can compare the storm start, rainfall duration, peak intensity, soil response, and movement curve. Without that record, a slope alarm may be discussed as a vague weather event. With it, the team can see whether movement followed the storm, whether it continued after rain stopped, and whether field inspection is needed. Rain data becomes part of the engineering timeline rather than a background note.
The environmental point should be part of a named monitoring question. It may explain wetting, drying, wind exposure, thermal movement, cabinet stress, or pressure variation, but that purpose needs to be visible in drawings and reports.
If the reading seems unusual, the team should check the physical condition of the station before drawing conclusions about the asset. Blockage, poor exposure, loose wiring, water entry, and changed surroundings can all create misleading patterns.
FAQ
Q: Can environmental data support asset management?
A: Yes. Long-term records help owners compare weather, exposure, maintenance events, and structural response across seasons and assets.
Q: How does it help during alarms?
A: It lets reviewers check whether a structural alarm followed rain, wind, temperature change, humidity rise, or another site condition.
Q: What should dashboards show?
A: Dashboards should link environmental channels to the structural risks they explain, rather than displaying unrelated values together.
Q: Why avoid product-list writing?
A: Readers need to understand monitoring purpose and field value; long product lists make the page harder to use and less natural.
Q: What is the best review habit?
A: Review environmental data with time-aligned structural readings, inspection notes, maintenance records, and the site event that triggered concern.
If the reading seems unusual, the team should check the physical condition of the station before drawing conclusions about the asset. Blockage, poor exposure, loose wiring, water entry, and changed surroundings can all create misleading patterns.
Reviews
James Thompson
The tiltmeters and accelerometers are very sensitive and provide precise data. Perfect for our structural health monitoring system.
Andrew Lee
The visualization software is intuitive and powerful. It helps us analyze monitoring data efficiently.
Latest Inquiries
To protect the privacy of our buyers, only public service email domains like Gmail, Yahoo, and MSN will be displayed. Additionally, only a limited portion of the inquiry content will be shown.
Evelyn***@gmail.comSouth Africa
Hi, we are a contractor working on tunnel construction and need settlement sensors and displacement ...
Emma***@gmail.comCanada
Dear Sir/Madam, we are interested in displacement transducers and settlement sensors for a geotechni...
Related product categories
- resistance of temperature sensor
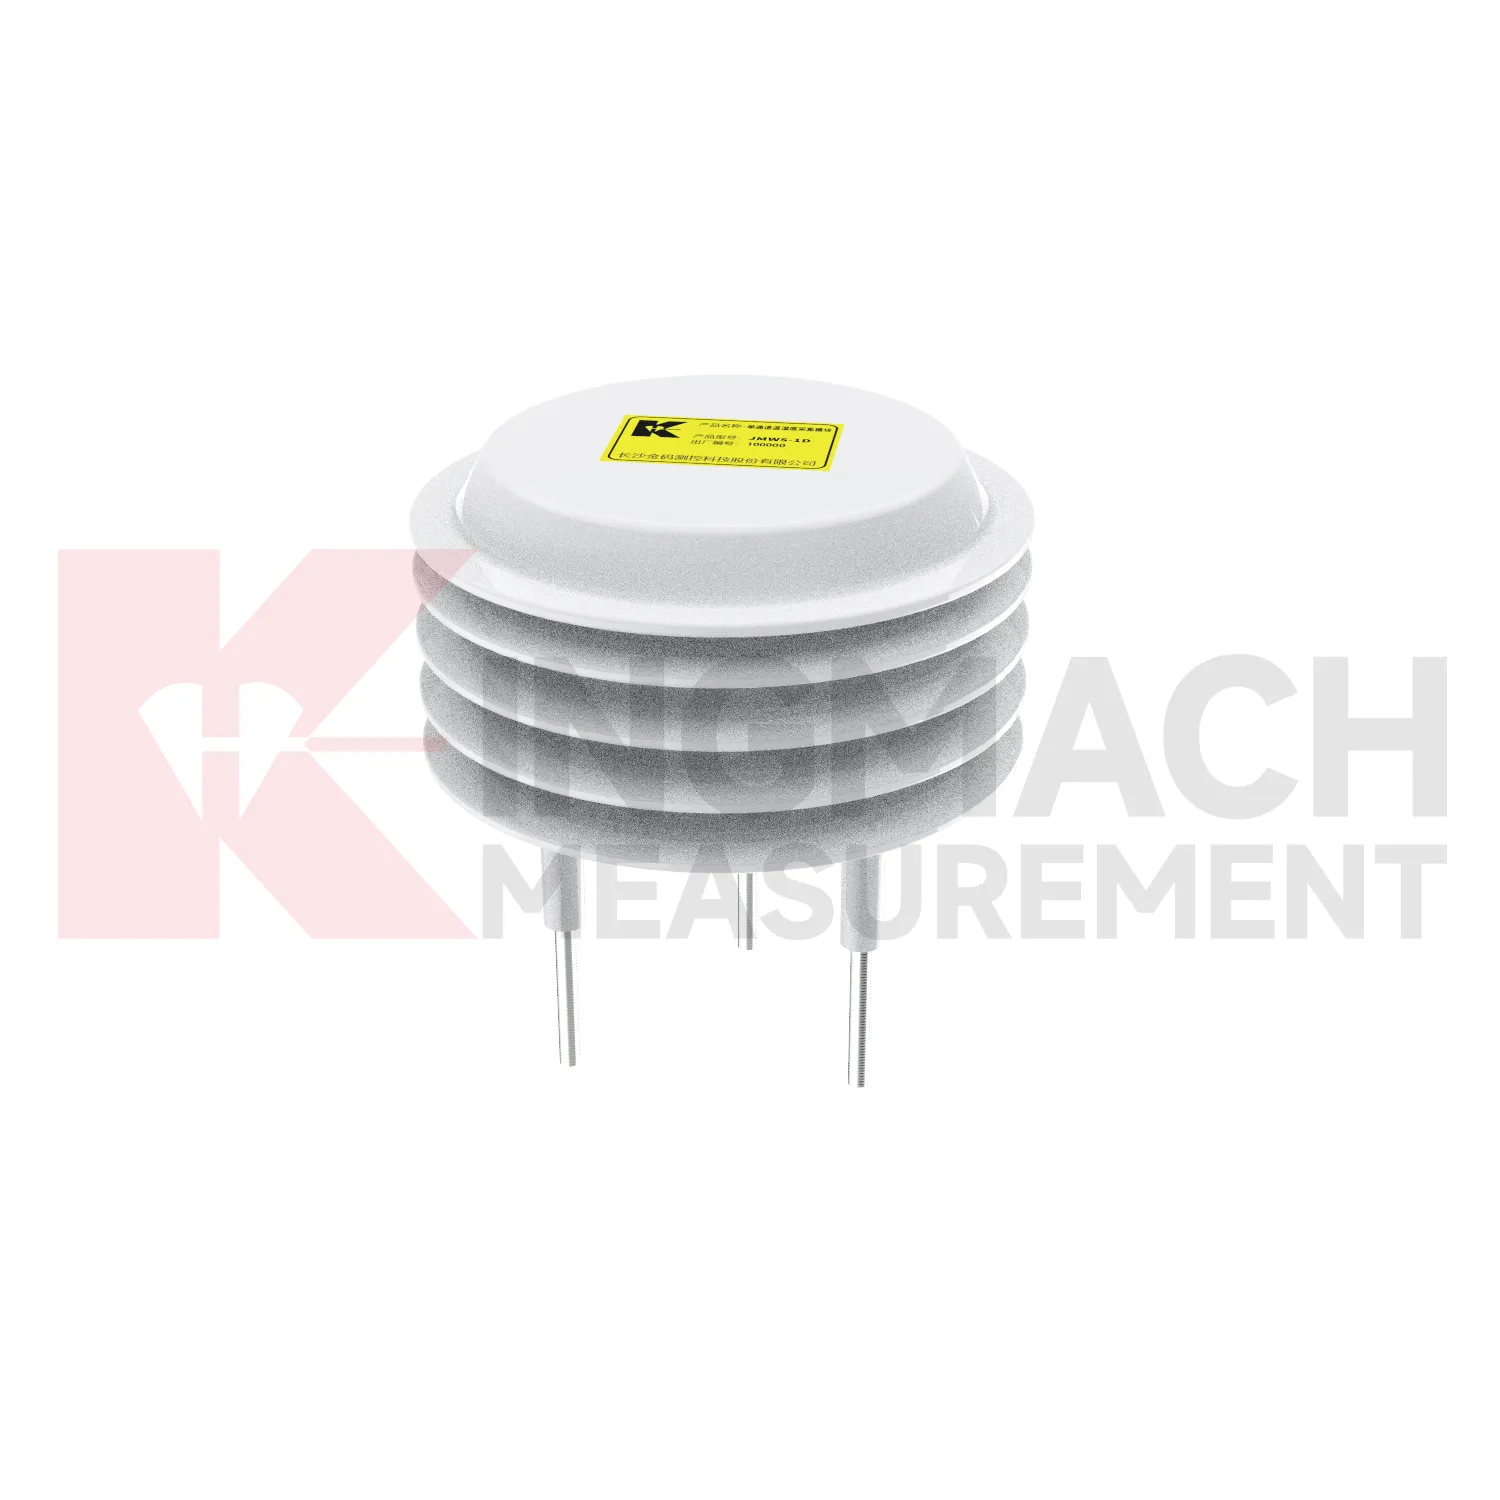
- Temperature and Humidity Acquisition Module
- water temperature sensor resistance
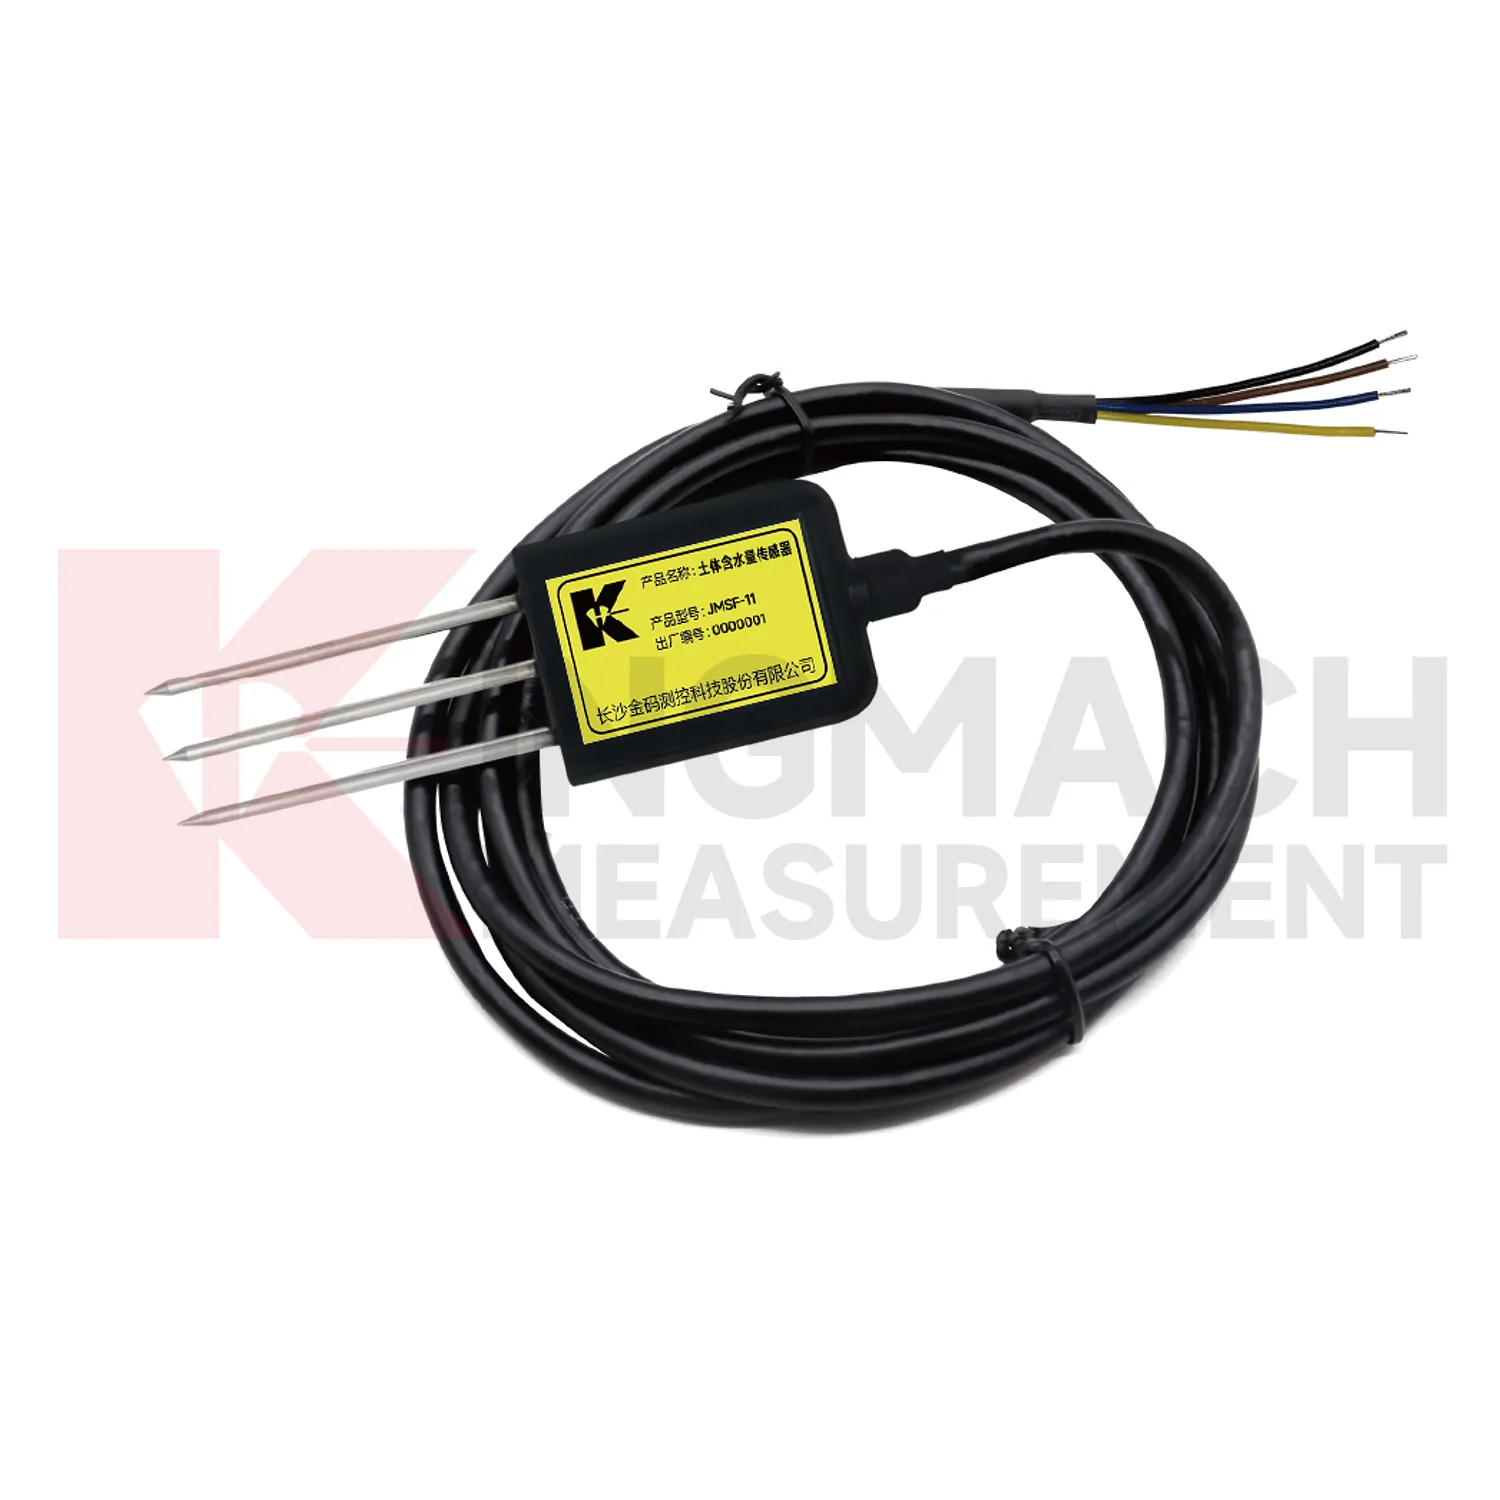
- soil moisture sensor
- soil moisture sensors
- capacitive soil moisture sensor
- best soil moisture sensor
- capacitive soil moisture sensors
- sensor soil moisture
- soil moisture sensor reviews
- capacitive soil moisture sensor v1 2
- resistive soil moisture sensor