 ar
ar bg
bg hr
hr cs
cs da
da nl
nl fi
fi fr
fr de
de el
el hi
hi it
it ko
ko no
no pl
pl pt
pt ro
ro ru
ru es
es sv
sv tl
tl iw
iw id
id lv
lv lt
lt sr
sr sk
sk sl
sl uk
uk vi
vi et
et hu
hu th
th tr
tr fa
fa ms
ms hy
hy ka
ka ur
ur bn
bn mn
mn ta
ta kk
kk uz
uz ku
ku
Daisy-Chained Digital Thermometer
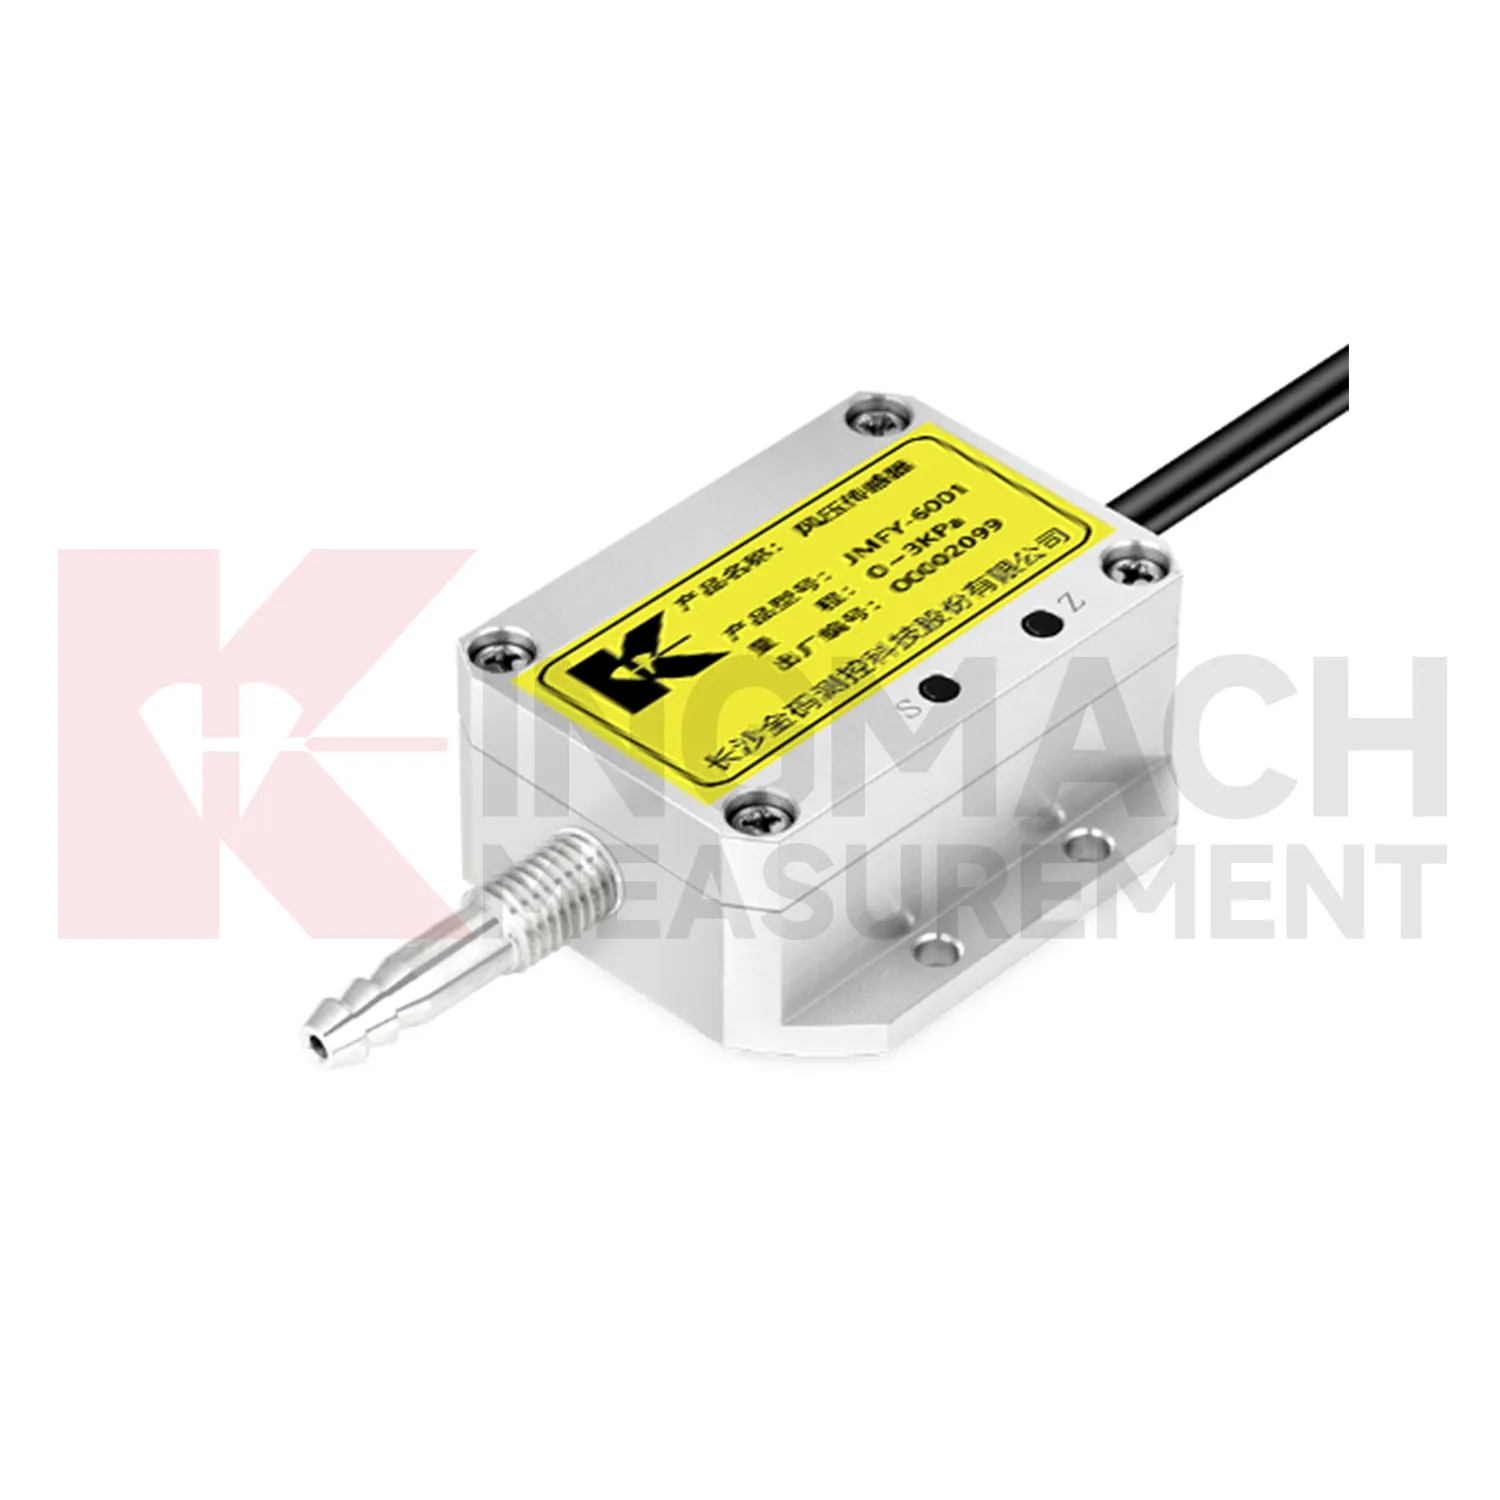
Pressure monitoring in Kingmach Daisy-Chained Digital Thermometer is useful when the project needs to understand wind load, air movement, gas pressure, or controlled pressure differences around equipment and structures. A pressure point may support bridge response review, ventilation systems, enclosed spaces, dry gas control, or antechamber monitoring. The installation should protect the pressure path from blockage, water, dust, loose tubing, and accidental disconnection. Because pressure data often changes quickly, channel naming and time alignment are important. If pressure is being compared with vibration, wind speed, or structural movement, the records should share a review timeline. A pressure value without context may be hard to judge. A pressure value connected to wind direction, operating condition, and structural response can explain why a vibration, alarm, or access issue occurred.
For owners, the strongest record is the one that remains understandable after staff changes. Clear units, plain point names, installation photos, maintenance notes, and linked structural channels make the data usable beyond the original project team.
For field teams, this point is most useful when the record shows the condition before the structural response, during the response, and after the site returns to routine operation. The note should include weather timing, inspection access, nearby construction, and whether the linked structural points changed in the same period.


Application of Daisy-Chained Digital Thermometer
Slope monitoring uses Kingmach Daisy-Chained Digital Thermometer to connect weather, soil conditions, and ground movement. The field problem is rarely just one number. Rain may fall at the surface, water may enter the soil slowly, and movement may appear hours or days later. A useful slope station should therefore combine rainfall history, buried wetness, ground displacement, tilt, crack observation, and inspection notes in one review timeline. Environmental points need careful placement: rainfall should be measured in an open area, soil wetness should be measured at meaningful depths, and cables should be protected from surface work or erosion. When movement accelerates after a wetting pattern, the monitoring team can inspect the affected area with stronger evidence. When movement does not match rainfall or soil wetness, other causes such as excavation, loading, drainage change, or retaining-structure movement may need attention.
During abnormal events, the first question is not only whether the value crossed a limit. The reviewer should ask what changed around the site, whether the related structure reacted, and whether a field inspection confirmed the same pattern.
Long-term value comes from consistency. A channel that keeps the same location, unit, maintenance history, and linked asset record can support seasonal comparison, post-storm review, and handover between construction and operation teams.
Maintenance teams should record cleaning, access difficulty, enclosure condition, cable repair, vegetation growth, nearby equipment changes, and the first normal reading after work. Those notes protect the meaning of the curve when old data is reviewed months later.
The future of Daisy-Chained Digital Thermometer
Future Kingmach Daisy-Chained Digital Thermometer reporting will make abnormal-event review more traceable. A report that says a slope moved after rain should show rainfall timing, wetting response, movement rate, and inspection results together. A report that says bridge vibration rose during wind should show wind direction, wind period, structural response, and related maintenance notes. This reduces manual work and makes reports easier to defend. Environmental records should follow the same naming and time standards as structural records. When the reporting workflow is consistent, owners can compare events across seasons, assets, and maintenance teams.
The next step is report structure that follows the event, not the instrument list. A storm report should gather rain, wetting, seepage, ground movement, photographs, and field actions. A heat-related report should gather temperature, strain behavior, expansion observations, and cabinet status. This makes the document easier for owners, designers, and field crews to review together.
Traceable reporting also protects future decisions. If the same asset produces another alarm years later, the team can compare event type, measured condition, inspection result, and repair action without rebuilding the story from scattered files. That continuity is often more useful than a single high-resolution curve.
Care & Maintenance of Daisy-Chained Digital Thermometer
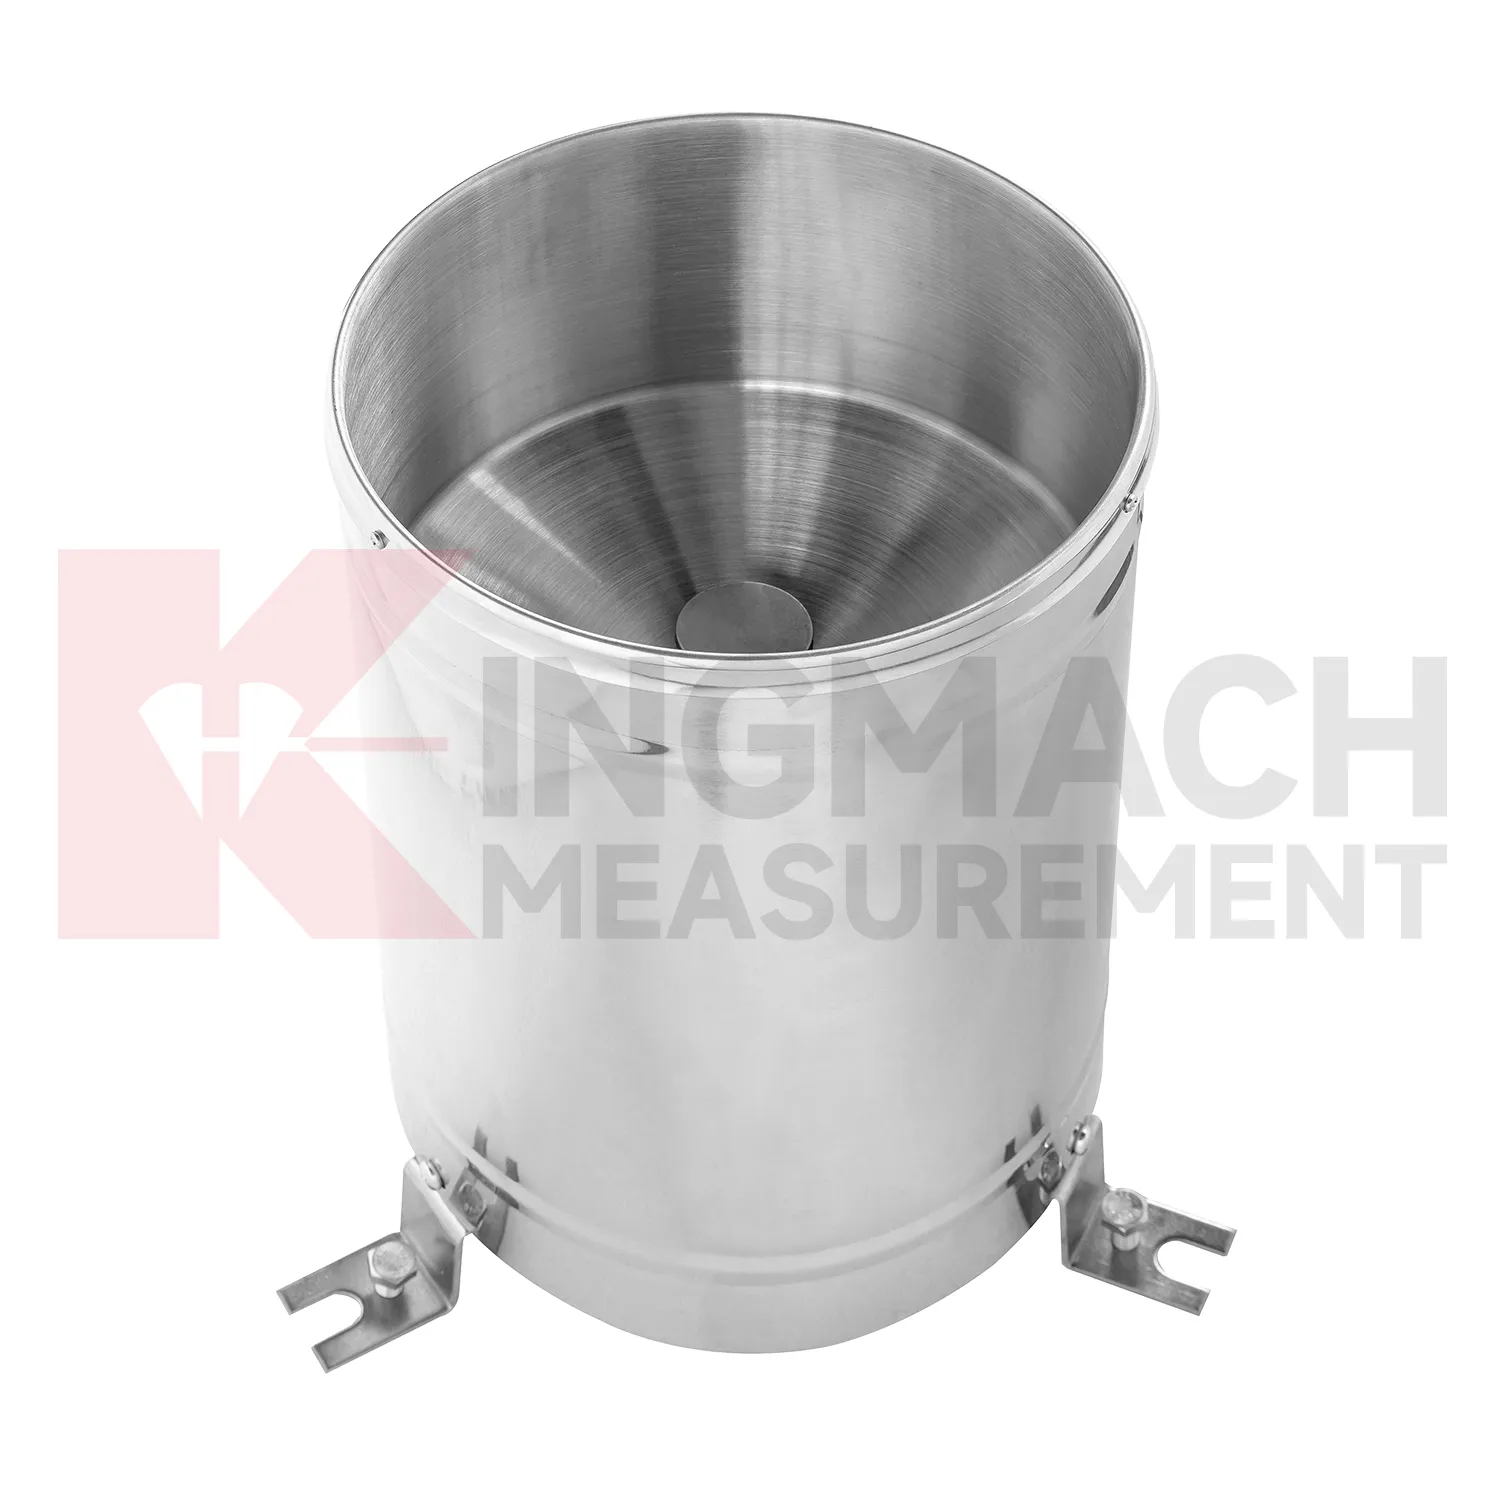
Rainfall maintenance for Kingmach Daisy-Chained Digital Thermometer should focus on keeping the catchment path clean and level. Leaves, dust, insects, scale, bird droppings, splash, and tilted mounting can distort rainfall records. The rain point should be inspected after storms, long dry periods, nearby earthwork, and seasonal debris build-up. Cleaning should be logged with date, condition, leveling status, and the first normal reading after work. Rainfall data is often used to explain slope movement, seepage, tunnel leakage, construction delay, or drainage performance. If the rain record is wrong, the engineering interpretation may also be wrong. Simple field care protects a much larger monitoring decision.
Maintenance teams should record cleaning, access difficulty, enclosure condition, cable repair, vegetation growth, nearby equipment changes, and the first normal reading after work. Those notes protect the meaning of the curve when old data is reviewed months later.
The environmental point should be part of a named monitoring question. It may explain wetting, drying, wind exposure, thermal movement, cabinet stress, or pressure variation, but that purpose needs to be visible in drawings and reports.
Kingmach Daisy-Chained Digital Thermometer
Kingmach Daisy-Chained Digital Thermometer helps engineering teams read the conditions around a structure before they judge the structure itself. Temperature, humidity, rainfall, wind, pressure, and soil wetness can all change how bridges, tunnels, slopes, buildings, dams, and construction sites behave. A deformation curve after a storm is different from the same curve during a dry week. A strain record during a heat wave needs a temperature background. A cabinet fault in a tunnel may have more to do with moisture than with the instrument connected to it. The purpose of this category is to make those surrounding conditions visible. When environmental records sit beside settlement, displacement, tilt, load, vibration, and inspection notes, engineers can explain why a reading changed instead of only seeing that it changed.
For field teams, this point is most useful when the record shows the condition before the structural response, during the response, and after the site returns to routine operation. The note should include weather timing, inspection access, nearby construction, and whether the linked structural points changed in the same period.
FAQ
Q: How does rainfall data support slope review?
A: Rainfall gives the timing and intensity background for movement, seepage, wetting, and field inspections after storms.
Q: Why measure soil wetness as well as rainfall?
A: Rainfall stays at the surface record, while buried wetness shows whether water reached the soil depth that may influence movement.
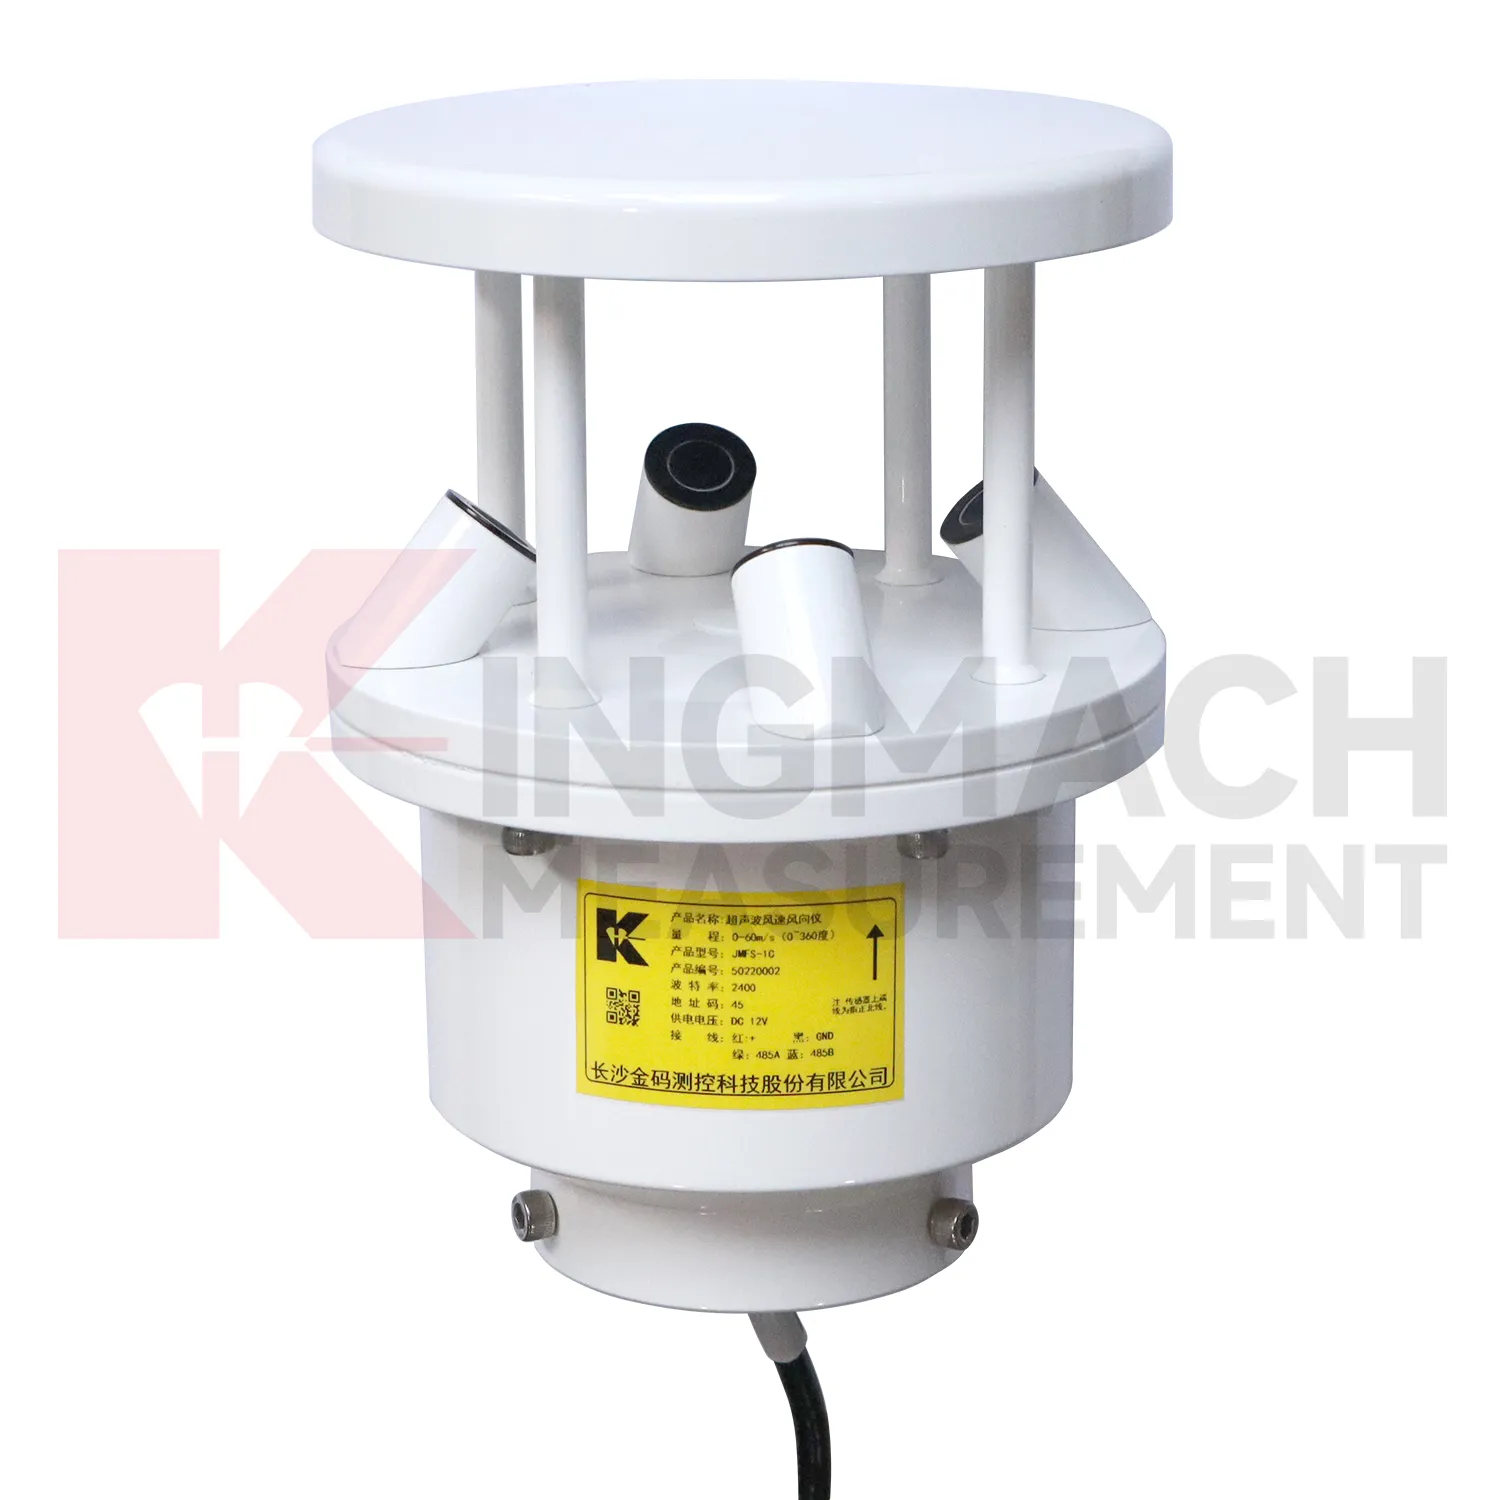
Q: How does wind data support bridge or tower monitoring?
A: Wind direction and exposure can explain vibration, deflection, access difficulty, and weather-driven structural response.
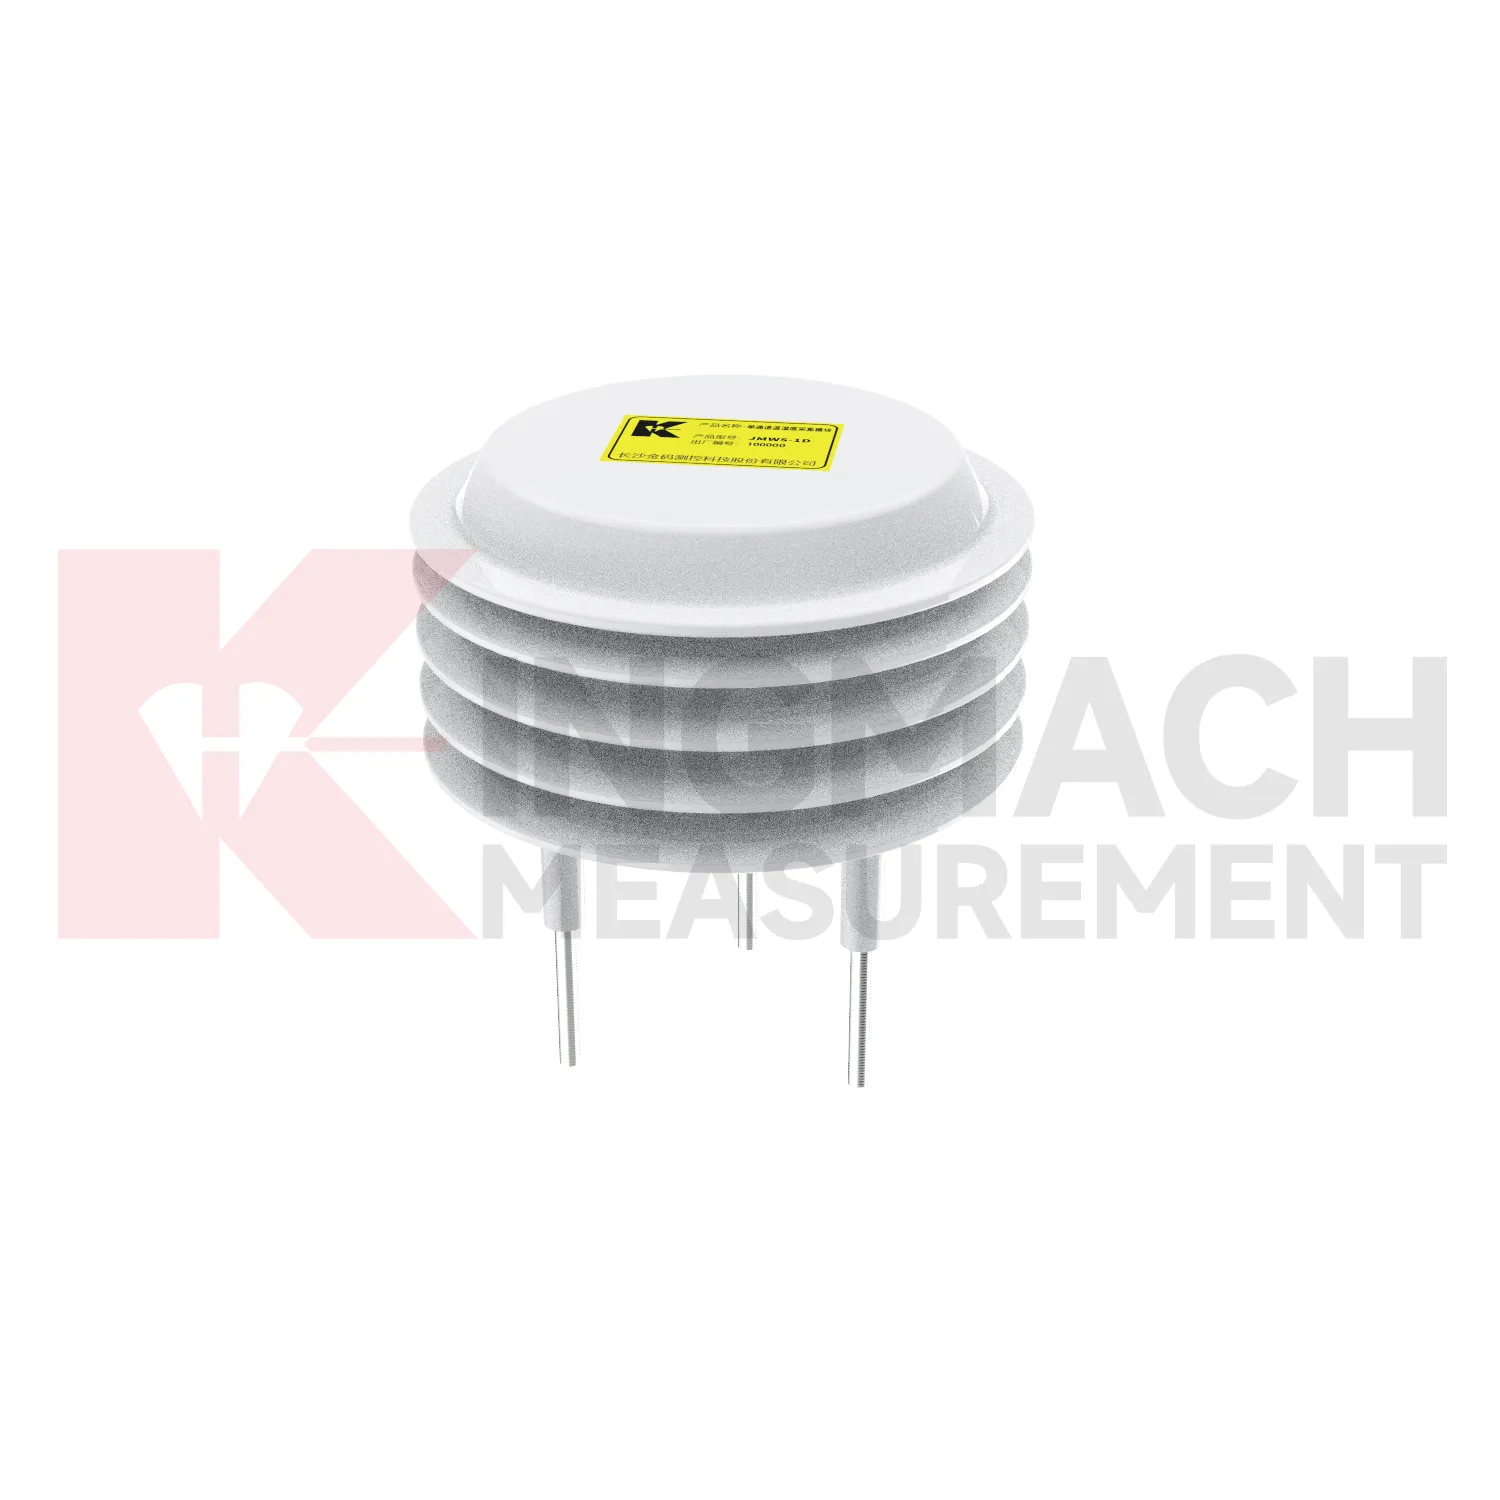
Q: Why monitor humidity underground?
A: Humidity can affect cabinets, connectors, corrosion, sensor stability, and operating conditions in tunnels, subways, mines, and equipment spaces.
Q: How does temperature help interpretation?
A: Temperature helps reviewers separate thermal behavior from structural change in strain, displacement, cabinet condition, or material response.
Long-term value comes from consistency. A channel that keeps the same location, unit, maintenance history, and linked asset record can support seasonal comparison, post-storm review, and handover between construction and operation teams.
Reviews
Robert Taylor
The weir flow meter is well-built and delivers accurate measurements. Great value for water management applications.
Daniel Brown
Excellent environmental monitoring sensors. The data is consistent, and the system integrates smoothly with our existing setup.
Latest Inquiries
To protect the privacy of our buyers, only public service email domains like Gmail, Yahoo, and MSN will be displayed. Additionally, only a limited portion of the inquiry content will be shown.
Evelyn***@gmail.comSouth Africa
Hi, we are a contractor working on tunnel construction and need settlement sensors and displacement ...
Charlotte***@gmail.comUnited Arab Emirates
Hi, we require instrumentation cables suitable for harsh environments. Could you advise on specifica...
Related product categories
- wind pressure sensor
- ultrasonic wind speed and direction sensor
- wind speed and direction sensor
- wind speed and wind direction sensor
- wind speed and direct sensor
- wireless wind speed and direction sensor
- wind direction and speed sensor
- wind speed and direction sensors
- tipping bucket rain gauge
- tipping bucket rain gauge resolution 0.2 mm standard
- tipping bucket rain gauges
- tipping bucket rain gauge resolution 0.1 mm 0.2 mm standard